Operations
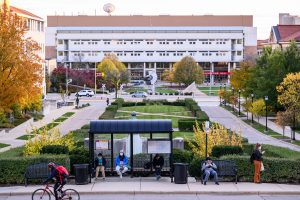
Here, you can learn about campus operations and the results of efforts to decrease the environmental impact, including UW–Madison’s energy footprint, how people get around campus, how much waste is diverted from landfills, and how much water the campus uses.
Operations Data
What are the greenhouse gas (GHG) emissions associated with main campus operations?
This section includes data on total GHG emissions by scope (presented in metric tons of carbon dioxide equivalent, MTCO2e) and GHG emissions per campus user and per square foot of building space. The Office of Sustainability reports emissions annually via the Sustainability Indicator Management & Analysis Platform (SIMAP). Additional information on air pollutant management in and around the UW–Madison campus can be found through the Wisconsin Department of Natural Resources Air Management Data Viewer.
You can learn more about GHG emission scopes and the organizational boundary here. The campus user figure is determined by full time equivalent (FTE) calculations that provide a single value with a meaningful combination of full-time and part-time students, faculty, and staff.
What is the total energy use on campus?
This section includes data on how much electrical and thermal energy is used on campus. Energy use is presented in Million British Thermal Units (MMBtu). The thermal energy load on campus is sourced from natural gas with occasional fuel oil in times of increased demand. For the main campus, the majority of electricity is provided by MGE and more information on their sustainability efforts can be found here.
- Read more about our campus heating and cooling systems here.
- Explore a fact sheet about campus district energy systems here.
Energy Use Intensity was calculated by summing the total energy use on campus (both electrical and thermal) and dividing by total square feet of building space. The campus population figure is determined by full time equivalent (FTE) calculations that provide a single value with a meaningful combination of full-time and part-time students, faculty, and staff.
What renewable electricity powers our campus?
This section includes data on renewable electricity sources for UW–Madison. Information on total campus energy use (thermal and electric) can be found in in the Total Energy Tab or Energy Use in State Facilities Report.
You can learn more about renewable energy programs here and how we compare to other institutions through our participation in the EPA Green Power Partnership via our partner profile page on the EPA site.
How much water does campus use?
This section includes data on how much water is used by buildings and people on campus.
Potable water (e.g., water that is fit for consumption) comes from the Madison Water Utility while Nonpotable water comes from lake water intakes used in campus heating and cooling plants. You can read more about lake water use in campus plants.
The weighted campus user calculation is documented here.
How much campus waste is diverted from the landfill?
This section includes data on the types of Municipal Solid Waste (MSW) that is generated on campus. MSW includes everyday items we use and then throw away, such as product packaging, grass clippings, furniture, clothing, bottles, food scraps, newspapers, appliances, paint, and batteries. This section also tracks how such waste is diverted from landfills through recycling, composting, and reuse.
The weighted campus user calculation is documented here.
How is waste handled from construction and demolition processes?
Waste generated during construction and demolition is more uniform and easily recycled. This section includes data on the construction and demolition waste diverted from landfills.
What are the greenhouse gas (GHG) emissions associated with how people get to campus?
This section includes estimated greenhouse gas emissions data that reflects the commuting choices of students and employees. The Commuter Solutions team offers many commuting options.
Transportation data presented below are the result of a model developed by the Office of Sustainability that utilizes the results of the biennial Transportation Services Survey Report, which is conducted to obtain broad transportation and commuting characteristics of students and employees.
Data will be updated following the release of the biennial Transportation Services Survey Report. Visualizations do not include emissions reflecting the walking and bicycling trips as they are assumed to be zero. For more information regarding how many students and employees walk or bike to campus, as compared to the other commuting options, please see the full report linked above.
For questions about the data or associated dashboard elements, please reach out to info@sustainability.wisc.edu.